


Products
Fast, Reliable, Everywhere


Solutions
Efficient, Innovative EV Charging Solutions.
News
We are committed to the innovation and application of EV charging.




Integrated “solar + storage + charging” (PV + BESS + EV charging) sites succeed or fail on three things:
Power matching (PV, battery, chargers, and the grid connection must work as one system)
Battery sizing (both kW and kWh must be sized for the real load profile and tariff)
Revenue and savings (a bankable model that captures all value streams without double-counting)
This article walks through a practical, engineering-first approach to design the system and estimate returns—using a method you can adapt to highway fast-charging hubs, commercial depots, retail parking, and fleet charging yards.
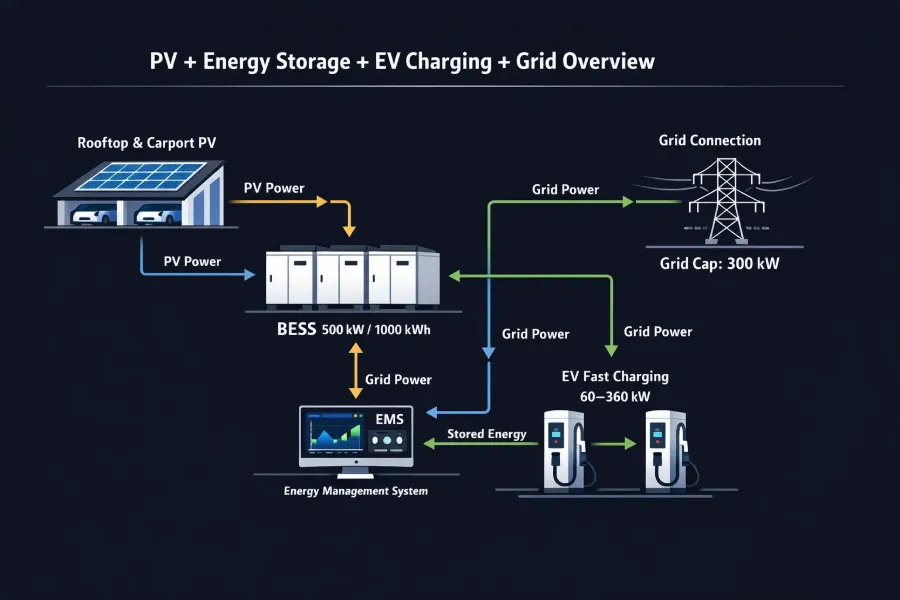
Before you size anything, define what the system is optimizing:
Maximize charging throughput (kWh/day and sessions/day)
Cap grid import (stay within a fixed interconnection limit)
Minimize electricity cost (TOU optimization, demand-charge reduction)
Increase renewable share (maximize PV self-consumption)
Improve resilience (backup power for critical loads)
Grid connection limit (kW): e.g., 300 kW maximum import
Tariff structure: TOU prices + demand charges + export rules
Space and civil limits: PV area, BESS footprint, transformer capacity
Operating pattern: peak hours, fleet schedules, public charging demand
Permitting / safety: fire code, setbacks, ventilation, protection schemes
Think of this as your “design box.” Your PV, BESS, and charger mix must fit inside it.
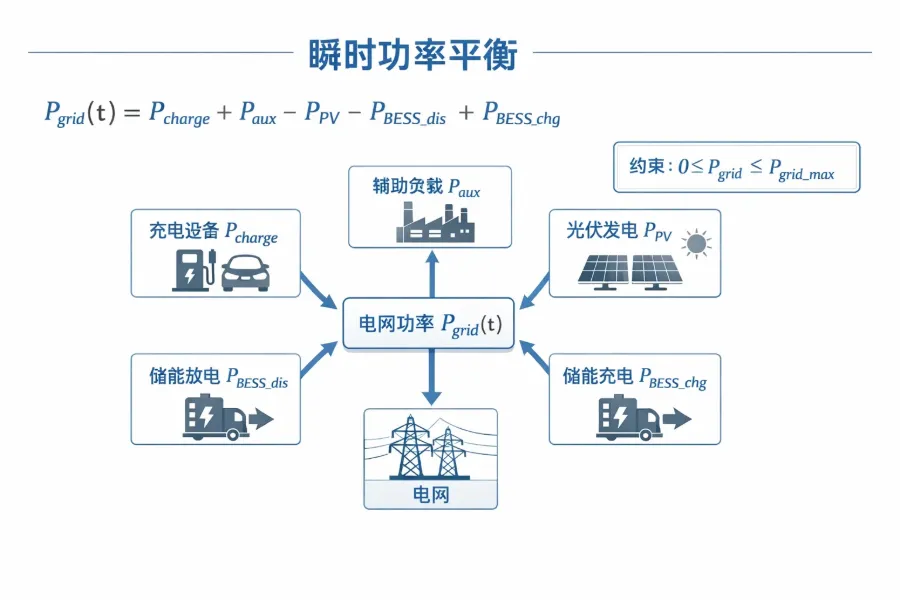
Power matching answers a simple question:
At any moment, can the site serve charging demand while staying within grid limits and using PV/BESS efficiently?
P_grid_max: Maximum allowed grid import (kW)
P_PV(t): PV output profile (kW over time)
P_charge(t): Charging demand profile (kW over time)
P_BESS_dis(t) / P_BESS_chg(t): Battery discharge/charge power (kW)
P_aux(t): Other site loads (kW)
At each timestep t (15-minute or 5-minute resolution is ideal):
P_grid(t) = P_charge(t) + P_aux(t) − P_PV(t) − P_BESS_dis(t) + P_BESS_chg(t)
And the grid constraint:
0 ≤ P_grid(t) ≤ P_grid_max
If your charging demand spikes above what PV + grid can deliver, the battery must discharge to fill the gap (or chargers must throttle).
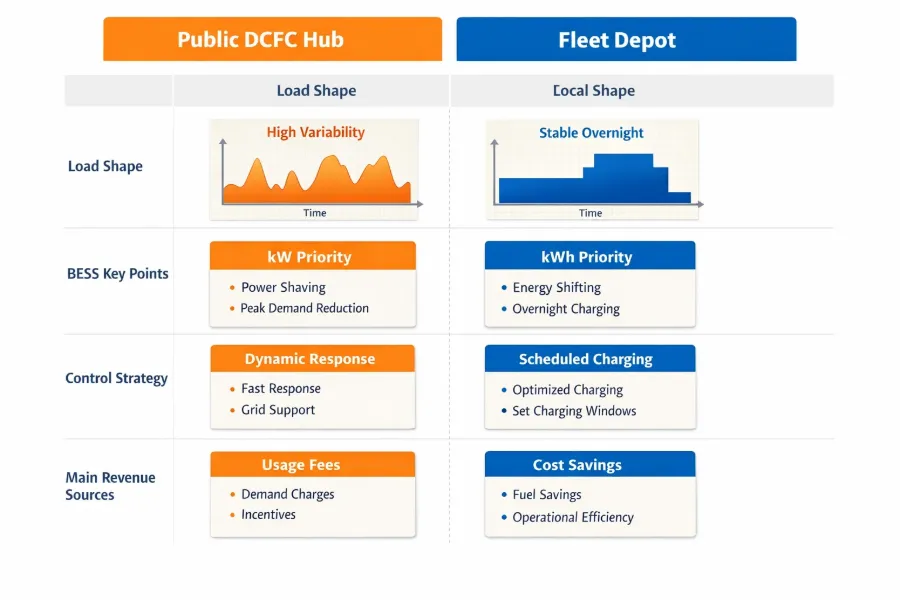
A site with 2×300 kW ultra-fast behaves very differently from 10×60 kW even if nameplate power is similar. Fast-charging demand is “spiky,” and spikes drive:
transformer sizing
demand charges
battery power rating (kW)
cable and switchgear costs
Rule of thumb (planning stage):
Public DCFC hubs → size BESS power (kW) to manage spikes
Fleet depots → size BESS energy (kWh) to shift bulk charging to low-cost windows
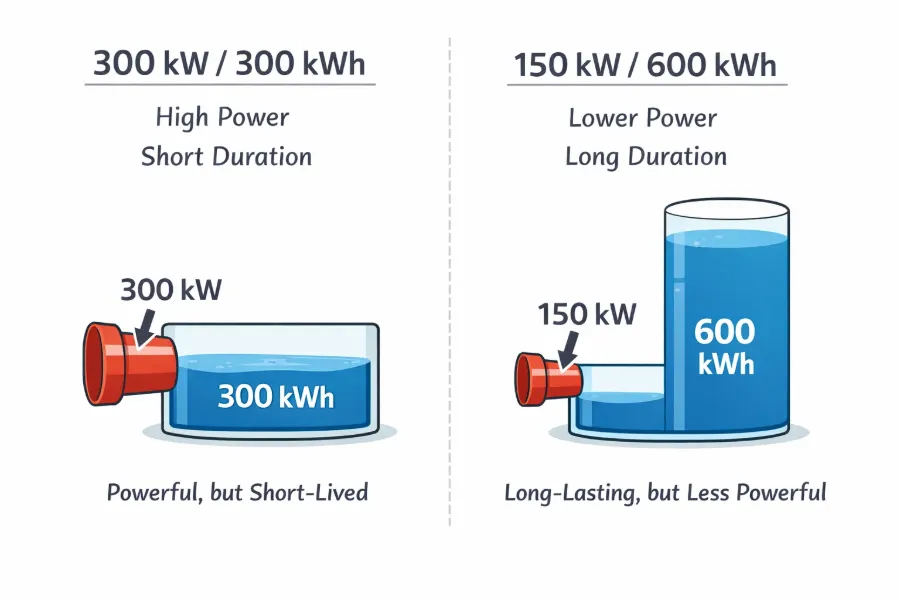
Battery sizing has two independent dimensions:
BESS power (kW): how fast the battery can charge/discharge
BESS energy (kWh): how long it can sustain that power
If the site is limited by grid import, battery power must cover the shortfall:
P_BESS_required ≈ max_t [ P_charge(t) + P_aux(t) − P_PV(t) − P_grid_max ]
Add a margin for:
inverter limits at high temperature
aging
reactive power requirements (if applicable)
Practical sizing guidance
For public fast charging with big peaks, BESS power is often 30–80% of (peak charging power − grid limit) depending on throttling strategy.
If you can enforce “smart charging” limits (dynamic load management), you can reduce BESS kW significantly.
Battery energy depends on how long you need support:
peak shaving duration (e.g., 1–3 hours)
TOU shifting window (e.g., charge at noon / off-peak, discharge at evening peak)
PV firming (smooth PV ramps)
backup requirement (e.g., 2 hours for critical loads)
A clean way to estimate minimum energy for grid-cap operation:
E_BESS_required ≈ Σ_t (P_BESS_dis(t) − P_BESS_chg(t)) × Δt / η_system
Where η_system includes inverter + battery round-trip losses.
Then adjust for usable depth-of-discharge (DoD) and reserve SOC:
Usable fraction often 80–90% for LFP systems (depending on warranty terms)
Keep operational reserve (e.g., 10–20% SOC) if resilience is needed
Battery life economics depend on:
total energy throughput (MWh/year)
average depth-of-discharge
temperature
C-rate (power relative to energy)
Your model should include:
Round-trip efficiency (typically 85–92% system-level)
Degradation (capacity fade over years)
Augmentation (optional) to maintain contracted performance
PV design is not “max roof = max ROI” if export value is low.
Estimate annual PV yield:
E_PV_annual ≈ PV_kWp × SpecificYield (kWh/kWp/year)
Map PV output against charging load:
How much PV is consumed on-site vs exported?
Does PV reduce grid import during expensive periods?
Value PV correctly:
Self-consumed PV offsets retail electricity (high value)
Exported PV earns feed-in (often low value)
In many markets, the best ROI comes from PV sized to mid-day on-site demand, not maximum possible kWp.
Integrated sites often look profitable on paper because value streams get counted twice. Avoid that by stacking value streams carefully and enforcing energy conservation.
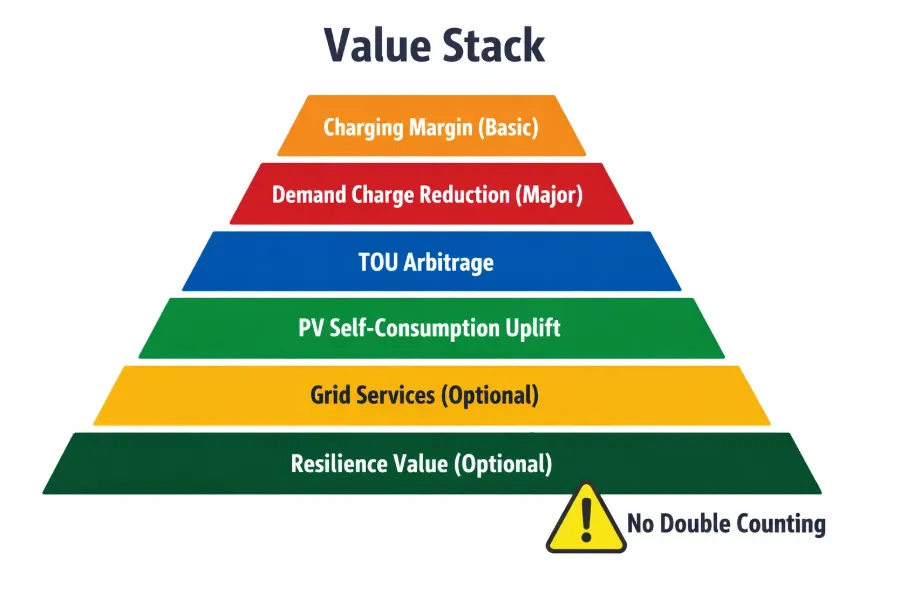
A) Charging margin (core revenue)
Charging revenue = delivered kWh × charging price
Energy cost = grid import + losses − PV self-consumption value
Note: in many cases, charging margin alone is thin if demand charges are high
B) Demand charge reduction (often the biggest BESS value)
Savings = (reduced peak kW) × (demand charge $/kW)
Requires accurate peak interval modeling (15-min / 30-min)
C) TOU arbitrage
Buy low, sell high internally:
Savings ≈ discharged kWh × (peak price − off-peak price) × η_effective
Must consider: the battery may already be committed to peak shaving
D) PV self-consumption uplift
PV + BESS can shift PV to evening charging, increasing self-consumption
Value = additional PV used on-site × retail price differential vs export rate
E) Grid services (market-dependent)
Frequency regulation, capacity, ancillary services (if allowed)
These may require performance guarantees and telemetry
F) Resilience / downtime avoidance
Monetize as avoided lost revenue during outages (site-specific)
At each timestep, the battery can only do one thing with the same kWh:
If it discharges to shave demand, that energy cannot also be counted as arbitrage unless it specifically shifts from low to high price periods.
If PV is used for charging directly, it cannot also be counted as “stored PV shifted.”
Model dispatch chronologically and let the value streams emerge from dispatch.
Here is a workflow you can use for most PV+BESS+EV charging projects:
Baseline site load (aux)
Charging sessions forecast (arrival curve + average session energy)
Convert sessions into P_charge(t) with realistic simultaneity
Max simultaneous power
Dynamic load management rules (priority, minimum power, throttling)
Service level target (e.g., “95% of sessions get ≥120 kW”)
Use typical daily curves by month (or simulation data)
Include clipping if inverter-limited
P_grid_max
TOU energy prices
Demand charge definition (monthly max, time-windowed, etc.)
Export compensation
Start with required peak support for worst-case windows
Reduce if you accept charger throttling
Run dispatch simulation for representative days (peak season, shoulder, low season)
Ensure SOC constraints hold without frequent “empty battery” events
Optimize for minimal kWh that still captures most value
CAPEX: PV, BESS, chargers, transformer, civil, EMS, installation
OPEX: maintenance, networking, land lease, battery augmentation (if any)
Revenues/savings by category
Outputs: annual cashflow, payback, IRR, sensitivity
Test at least:
utilization (sessions/day)
demand charges
charging price spread
battery cost and cycle life
grid cap changes
Site concept: Retail parking + public fast charging
Grid import limit: 300 kW
Chargers: 2×150 kW + 4×60 kW (nameplate total = 540 kW)
PV: 250 kWp
Candidate BESS: 300 kW / 600 kWh (0.5C energy-to-power ratio = 2 hours at 300 kW)
Peak simultaneous charging might hit 420–500 kW during busy hours.
With only 300 kW grid, you must either throttle chargers or discharge battery.
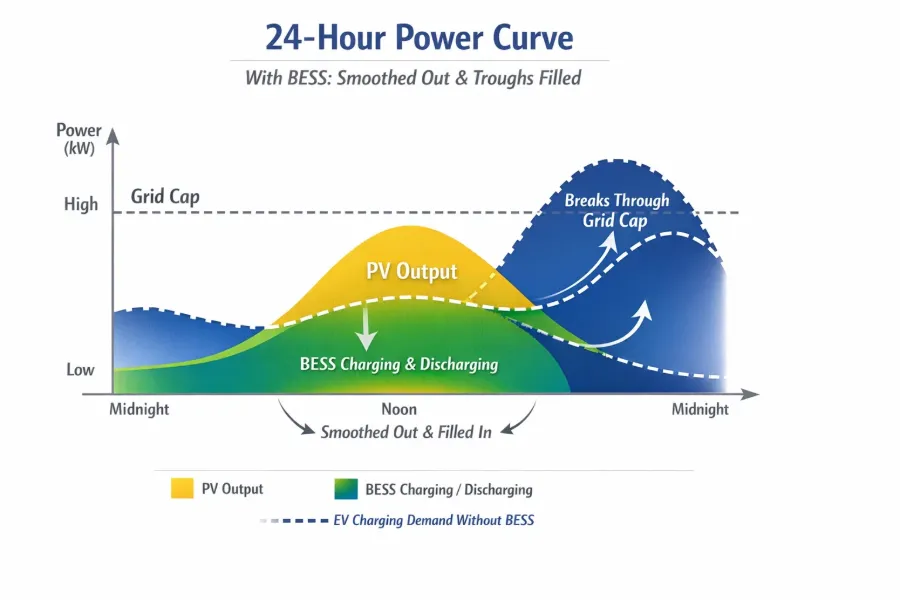
PV contributes up to ~150–220 kW at midday (season dependent)
Battery provides the remaining boost during spikes:
Example spike: charging demand 450 kW, PV 120 kW
Needed from grid + battery = 330 kW
Grid cap = 300 kW → battery discharges 30 kW (small in this moment)
But if PV is low (evening), the battery could need 150 kW+
If evening peak lasts ~2 hours with average battery discharge 200 kW:
Energy required ≈ 200 kW × 2 h = 400 kWh Add losses and reserve SOC:
With 90% round-trip and 15% reserve:
Required nominal ≈ 400 / (0.85 usable × 0.90 efficiency) ≈ 523 kWh
So 600 kWh is reasonable to prevent “battery empty” events.
Demand charge savings: reduce monthly peak from ~450 kW to 300 kW
TOU shifting: charge battery at midday PV/off-peak, discharge at evening peak
PV self-consumption: store excess PV and use later for charging
Customer experience: maintain higher delivered kW without expensive grid upgrades
This is exactly why integrated PV+BESS enables high-power charging under constrained interconnections.
Good economics require good control and metering.
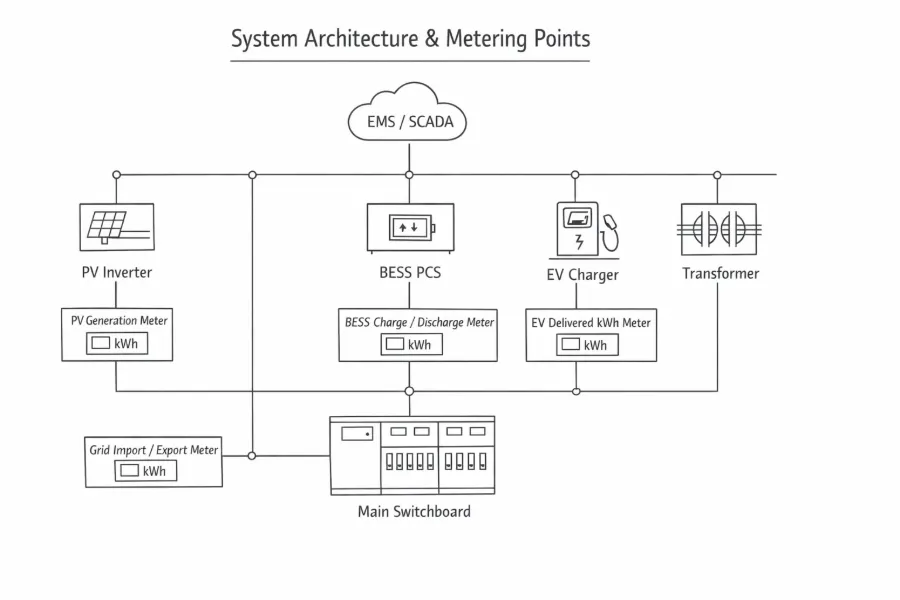
EMS (Energy Management System): real-time dispatch, SOC control, tariff-aware scheduling
Dynamic Load Management for chargers: prevents uncontrolled peaks
Revenue-grade metering: separate PV generation, grid import/export, BESS charge/discharge, EV delivered kWh
Protection and power quality: harmonics, reactive power control, islanding protection
Thermal management: battery/inverter performance depends heavily on temperature
Peak shaving first, then TOU arbitrage with remaining headroom
PV self-consumption priority (PV → EV first, then PV → BESS) when export is low
SOC guardrails (keep enough SOC for forecasted peak window)
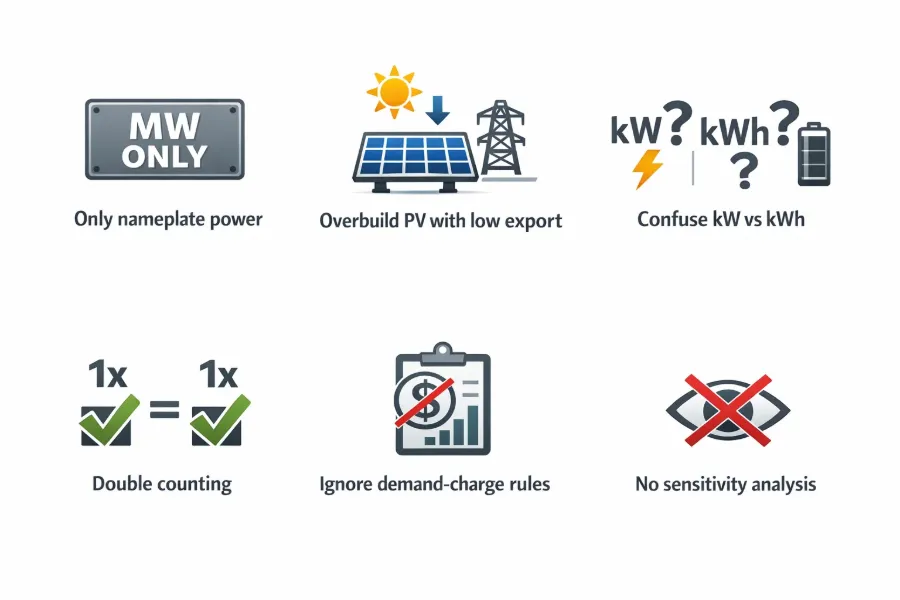
Sizing only by nameplate power
→ Use time-series modeling; peaks and simultaneity drive costs.
Overbuilding PV when export is low
→ Size PV to on-site absorption or pair with storage that can monetize it.
Confusing battery kW and kWh
→ kW manages spikes; kWh manages duration and shifting.
Double-counting battery value
→ Dispatch chronologically; let savings emerge from power balance.
Ignoring demand charge definitions
→ Some tariffs use time windows or ratchets; model the correct rule.
No sensitivity analysis
→ Utilization uncertainty is huge; run best/base/worst cases.
15-minute load profile built (EV + aux)
Charger policy defined (throttling rules and service-level targets)
PV profile modeled and matched to load
Grid cap and tariff rules confirmed (TOU + demand + export)
BESS kW sized for worst-case peak support
BESS kWh sized for peak duration + SOC reserve + losses
Dispatch simulation produces stable SOC behavior
Financial model avoids double counting and includes degradation/OPEX
Sensitivity analysis completed (utilization, tariffs, costs)
EMS + metering + protection architecture defined
A PV + BESS + EV charging site is not three separate products—it’s one integrated power plant with a customer-facing interface. If you match power correctly, size the battery for both kW and kWh, and model revenues with dispatch realism, you can unlock fast-charging growth even under tight grid constraints—often faster and cheaper than a grid upgrade.